Data Description
Short description
We have a dataset here that we going to be using to analyze . This is a genetic sale data from some company that operates all around the world.
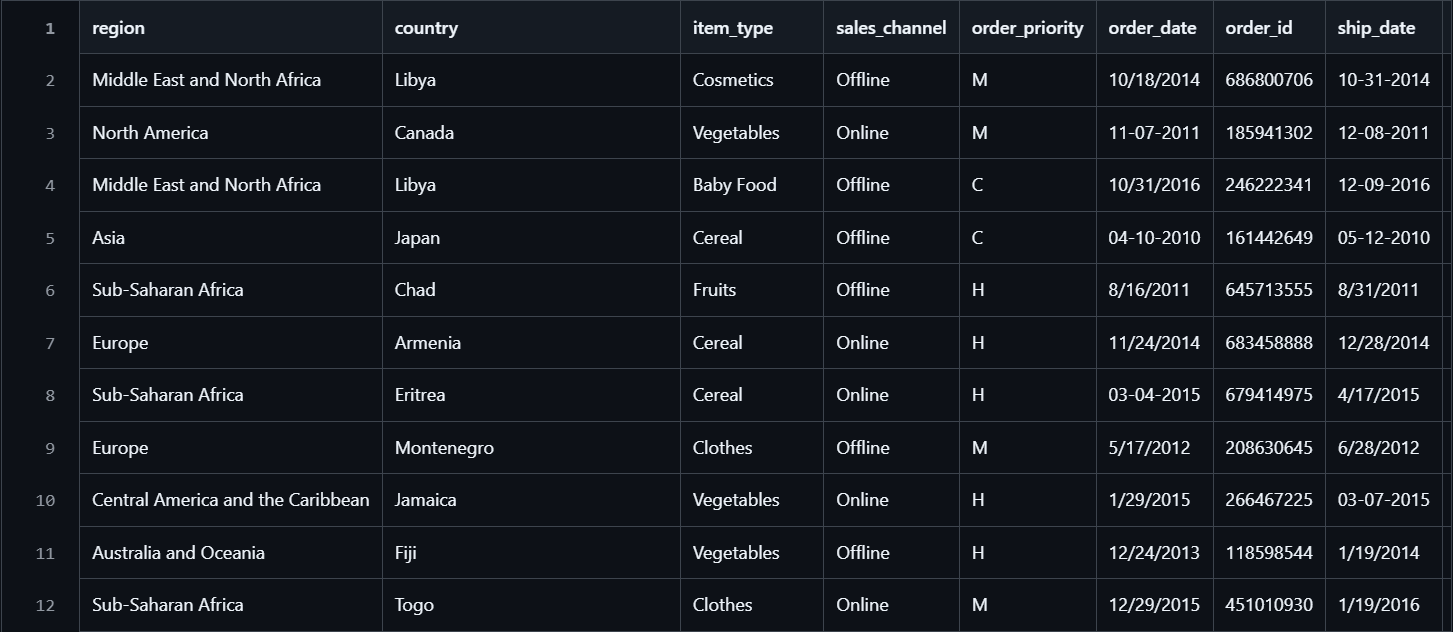
But there is something critical to consider. Both order_date and ship date, you’ll notice the data would be a little bit corrupted (eg. 10/18/2014, 11-07-2021). We’ll do transformation later to fix this.
📊1.Dataset Overview
This dataset contains 1,000 individual sales transactions recorded between January 1, 2010 and July 26, 2017 for a global consumer-goods company. It captures key information on products sold, geographic markets, order/ship dates, sales channels, and financial metrics (revenue, cost, profit).
Use Cases & Business Goals:
Revenue & Profit Analysis: Understand which regions, products, and channels drive the most revenue and profit.
Supply-Chain & Lead-Time Optimization: Measure order-to-ship delays and identify opportunities to reduce fulfillment times.
Demand Forecasting & Inventory Planning: Analyze historical sales patterns by item type and region to build predictive models.
Priority & Channel Strategy: Evaluate how order priority (e.g. “High” vs. “Low”) and sales channel (Online vs. Offline) impact overall performance.
2. Business Requirement
The primary objective is to demonstrate an end-to-end data engineering and analytics workflow:
Ingestion & ETL
Extract raw CSV into a data lake
Transform dates, calculate lead times, and validate financial computations
Load cleansed data into a relational database or analytics warehouse
Analytics & Visualization
Build dashboards (Power BI, Tableau) to monitor key metrics by region, product, channel, and priority
Implement SQL queries and/or Python scripts to compute rolling averages, growth rates, and outlier detection
Predictive Modeling
Train models to forecast monthly sales volume and profit by product category and geography
Evaluate model performance and integrate into a simple web app (Flask + Electron) for business users
This dataset gives full visibility into both top-line (revenue) and bottom-line (profit) performance, enabling demonstration of data‐driven decision-making.
3. Column Definitions
Here’s the schema represented as a Markdown table:
| Column | Type | Description |
|---|---|---|
| region | String | World region where the order was placed. E.g., “Asia”, “Europe”, “Sub-Saharan Africa”. |
| country | String | Country of the customer (ISO names). |
| item_type | String | Product category sold (e.g., “Fruits”, “Cereal”, “Cosmetics”, “Baby Food”). |
| sales_channel | String | Order channel: Online or Offline. |
| order_priority | String | Priority of the order: C (Critical), H (High), M (Medium), L (Low). |
| order_date | Date | Date the order was placed. Formatted MM/DD/YYYY. |
| order_id | Integer | Unique identifier for the sales transaction. |
| ship_date | Date | Date the order was shipped. Formatted MM-DD-YYYY. |
| units_sold | Integer | Number of units sold in the order. |
| unit_price | Float | Selling price per unit (in USD). |
| unit_cost | Float | Cost per unit (in USD). |
| total_revenue | Float | Computed as units_sold × unit_price. |
| total_cost | Float | Computed as units_sold × unit_cost. |
| total_profit | Float | Computed as total_revenue − total_cost. |